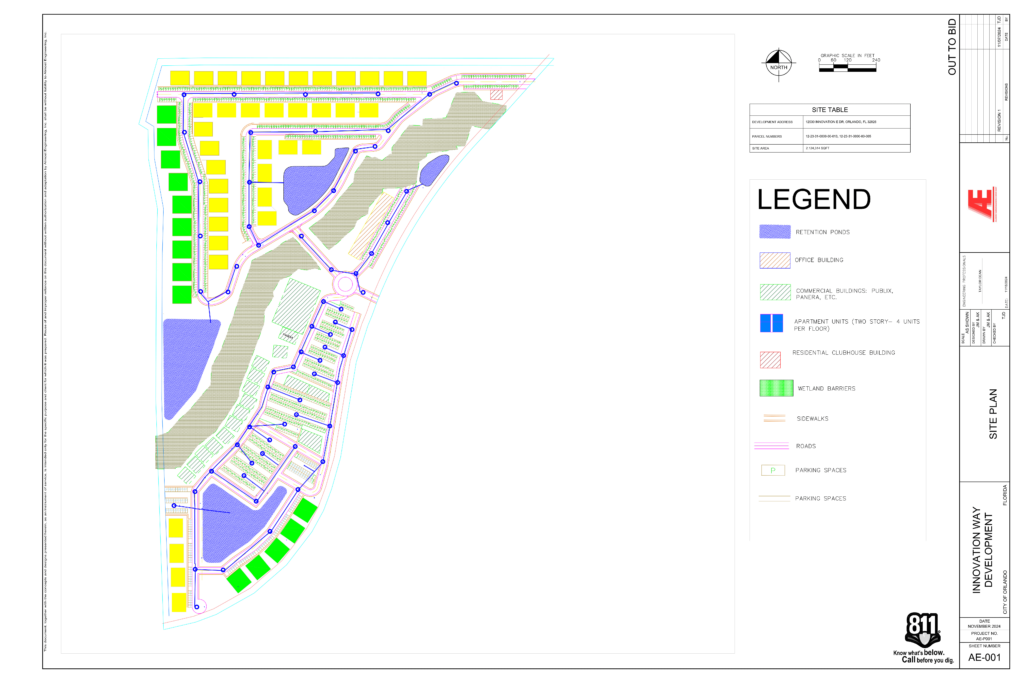
Project Background:
- Team Name:
- Almost Engineering Company
- Location:
- 12530 Innovation E Dr, Orlando, FL 32828, within the Avalon Park area.
- Total Site Area:
- Approximately 48.7 acres of buildable land
- Jurisdiction:
- St. Johns River Management District
- Current Site:
- Planned development
- Future Land Uses are:
- Low-Density Residential (LDR)
- Commercial (C)
- Office (O)
- Re-Zoning:
- Residential: Multiple-Family Dwelling District (R-3)
- Office: Professional Office District (P-O)
- Commercial: General Commercial District (C-2)
- Office Area:
- Minimum – 10,000 sq.ft
- Proposed – 15,000 sq.ft
- Commericial Area:
- Publix – 28,000 sq.ft (min. req. 28,000 sq.ft)
- Retail – 51,685 sq.ft (min. req. 30,000 sq.ft)
- Panera – 3,750 sq.ft (min. req. 2,500 sq.ft)
- Total – 83,435 sq.ft
- Residential Area:
- 261,000 sq.ft
- 51 Total Apartment Buildings
- 408 Dwelling Units
- Site Plan Land Use:
- 2 Proposed Driveways
- 4 Stormwater Ponds
- Pedestrian Boardwalk
- 192 ft long, 8 ft wide
- Proposed Parking
- 1409 Total Spaces
- 88 Compact Spaces
- 29 Handicap Spaces
Responsibilities:
- Using Autodesk Civil3D & AutoCAD to create concept site plan for Innovation Way development
- Conducted research to find setback and buffer requirements for the development
- Using Excel & Google Sheets to create multiple sheets to make work more efficient
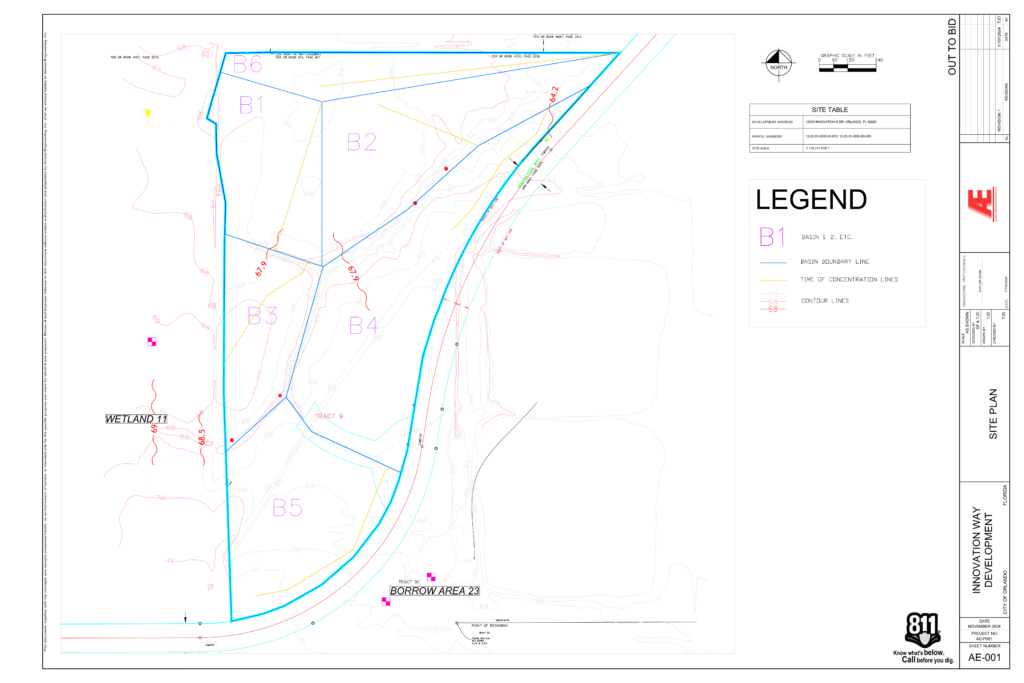
- Examples: Weekly Timesheet, Basin Calculators, Stormwater Piping
- Aided in modeling Design Storm Precipitations in Stormwise/ICPR4 program
- Working with colleagues to create Stormwater, Wastewater, Traffic memos for Client (Google Docs)
- Aided in finding Planned and Programmed Improvements for Innovation Way while preparing Traffic Memo
- Documentation Used: Capital Improvement Plan (CIP)
- Provided by Metroplan Orlando, the City of Orlando, and the Orange County Government
- Documentation Used: Capital Improvement Plan (CIP)
Construction Documents I Prepared:


Pre & Post Development Flow Comparision:
Design Storm | Pre-Development | Post-Development |
| Flow rate (cfs) | Flow Rate (cfs) | |
| St. Johns River Mean Annual 2.3 yr/24 hr | 33.70 | 19.45 |
| St. Johns River 25 yr/24 hr | 78.1 | 71.79 |
| Orange County 25 yr/24 hr | 52.85 | 49.95 |
Since our post-Development flows were calculated to be less than in pre-development, this means our proposed development would be an improvement to the community!